Do breastfed and formula-fed babies need different charts?
Breastfed and formula-fed babies can use the same WHO charts.
Tell your doctor how your baby feeds when discussing growth.
BABY GROWTH · INDIA
Compare baby weight and height with World Health Organization growth charts.
Check weight, length, or both from birth until the fifth birthday.
COMPARE THE MEASUREMENTS YOU HAVE
ENTER YOUR MEASUREMENTS
Start with a birth date, then add any measurements you have.
YOUR MEASUREMENTS
Start with the birth date and the date you want to check. A birth date alone shows age in months, weeks, and days.
Add weight, length, or both to see growth results. Use readings from the same visit when entering both measurements.
Select kg or g beside the weight field.
| Detail | What to enter |
|---|---|
| Birth date | Date from the birth record |
| Date to check | Date of the measurement, or the chosen age check |
| Boy or girl chart | Match the clinic record |
| Weight | kg or g, when available |
| Length or height | cm and lying or standing position, when available |
| Born early? | Check pregnancy weeks, then choose yes, no, or unsure |
| Swelling in both feet? | Yes, no, or unsure when entering weight |
THREE DIFFERENT QUESTIONS
Each result compares a different part of baby growth. The three percentiles can differ because they compare different measurements.
| Result | What it compares | What it cannot show |
|---|---|---|
| Weight for age | Weight at the same age and sex | Overweight without length or height |
| Length or height for age | Length or height at the same age and sex | Why a child is short for their age |
| Weight for length or height | Weight at the same length or height and sex | The cause of a feeding or health problem |
VALUES AT EACH AGE
The table shows middle weights and lengths from WHO growth charts. Doctors call the middle value the median, or 50th percentile.
A middle value is a comparison point, never a personal weight goal. From 24 months, the height columns show standing measurements.
| Age | Boys: kg | Girls: kg | Boys: cm | Girls: cm | How to measure |
|---|---|---|---|---|---|
| Birth | 3.3 | 3.2 | 49.9 | 49.1 | lying length |
| 1 month | 4.5 | 4.2 | 54.7 | 53.7 | lying length |
| 2 months | 5.6 | 5.1 | 58.4 | 57.1 | lying length |
| 3 months | 6.4 | 5.8 | 61.4 | 59.8 | lying length |
| 4 months | 7 | 6.4 | 63.9 | 62.1 | lying length |
| 5 months | 7.5 | 6.9 | 65.9 | 64 | lying length |
| 6 months | 7.9 | 7.3 | 67.6 | 65.7 | lying length |
| 7 months | 8.3 | 7.6 | 69.2 | 67.3 | lying length |
| 8 months | 8.6 | 7.9 | 70.6 | 68.7 | lying length |
| 9 months | 8.9 | 8.2 | 72 | 70.1 | lying length |
| 10 months | 9.2 | 8.5 | 73.3 | 71.5 | lying length |
| 11 months | 9.4 | 8.7 | 74.5 | 72.8 | lying length |
| 12 months / 1 year | 9.6 | 8.9 | 75.7 | 74 | lying length |
| 18 months | 10.9 | 10.2 | 82.3 | 80.7 | lying length |
| 24 months / 2 years | 12.2 | 11.5 | 87.1 | 85.7 | standing height |
| 36 months / 3 years | 14.3 | 13.9 | 96.1 | 95.1 | standing height |
| 48 months / 4 years | 16.3 | 16.1 | 103.3 | 102.7 | standing height |
SEE THE GROWTH CURVES
Choose the boy or girl chart, then select a comparison. On weight-for-age charts, read age along the bottom and weight up the side.
Each curved line marks a percentile on the growth chart. The result chart adds a dot for your entered measurement.
On length-for-age charts, the side scale shows length in centimetres. Weight-for-length charts show length along the bottom and weight up the side. Open the values table below the chart to read individual numbers.
The chart lines compare measurements; they never set personal weight goals.
READ THE NUMBER
A baby growth percentile compares a measurement with others on the WHO chart.
At the 25th weight percentile, roughly 25% of babies weigh less. About 75% weigh more within the same age and sex group. The 50th percentile marks the middle of the WHO chart.
A higher percentile alone cannot show better health.
A result between those lines cannot confirm good health. Your baby may need a check even within that range.
A child doctor, or paediatrician, also checks symptoms and earlier growth.
A z-score shows how far a reading is from the chart middle. Zero marks the middle; minus scores fall below it. Scores above zero fall above the middle of the chart.
Underweight describes low weight for age on the chart. Wasting describes low weight compared with length or height. Stunting describes length or height that is low for age.
Use the table to match each term with its measurement. Weight for age alone cannot show overweight or obesity. A doctor checks the cause before recommending changes to feeding.
| Growth label | Measurement used | Z-score cutoff |
|---|---|---|
| Underweight | Weight for age | Below −2; severe below −3 |
| Wasting | Weight for length or height | Below −2; severe below −3 |
| Stunting | Length or height for age | Below −2; severe below −3 |
| Possible risk of overweight | Weight for length or height | Above +1 through +2 |
| Overweight | Weight for length or height | Above +2 through +3 |
| Obesity | Weight for length or height | Above +3 |
LENGTH AND WEIGHT TOGETHER
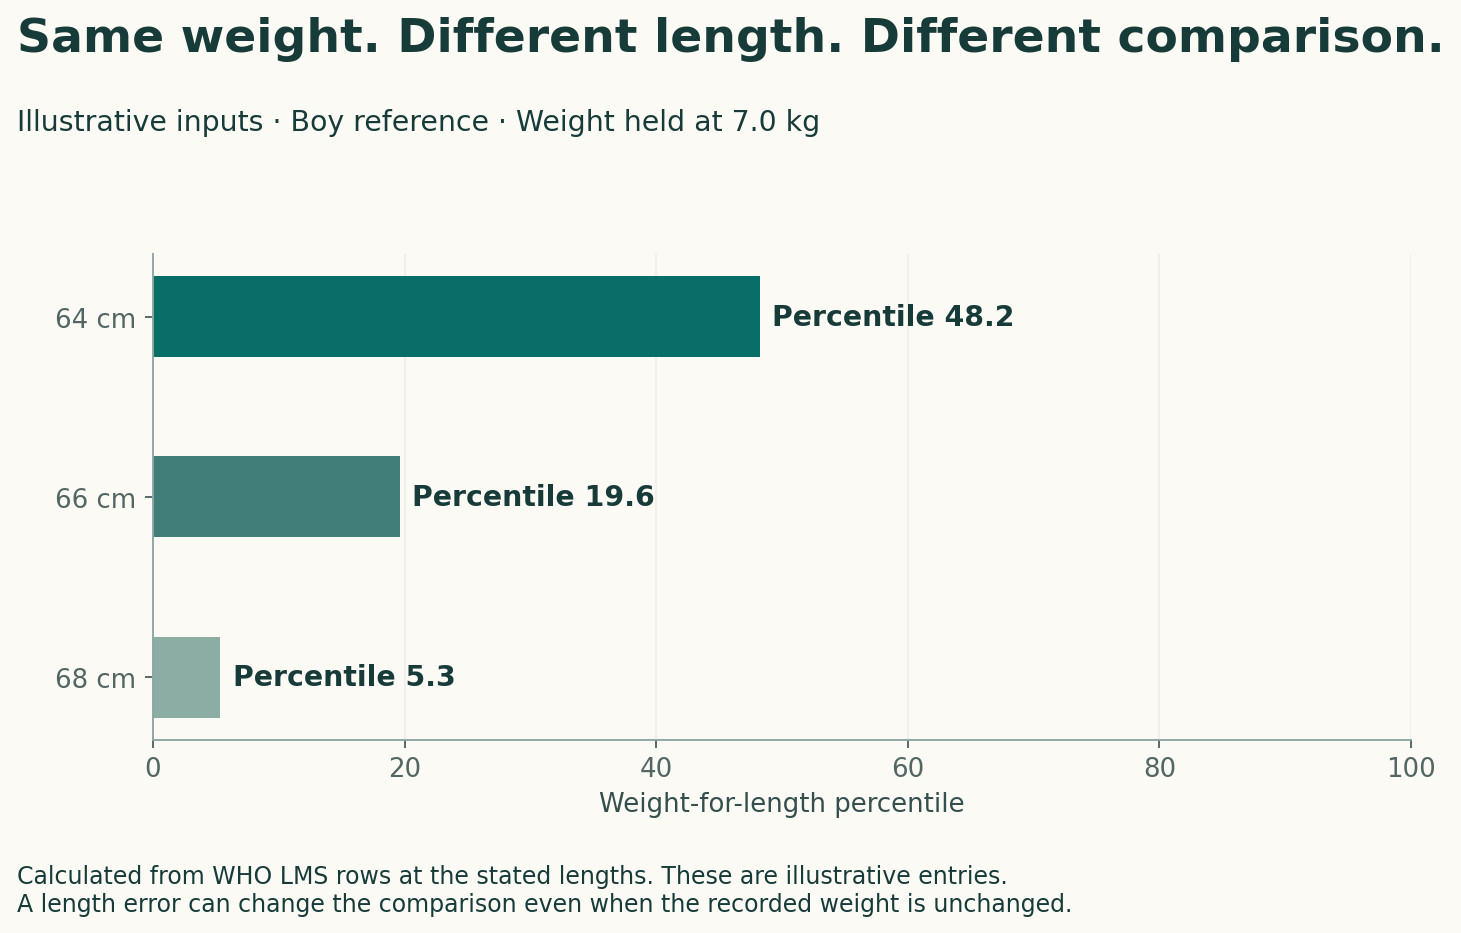
The weight-for-length percentile changes when you enter a different length. For a boy weighing 7 kg, 64 cm places him near the 48th percentile.
At 66 cm, the same weight sits near the 20th percentile. At 68 cm, it falls close to the fifth percentile.
These example readings show why an accurate length measurement is important. Recheck both readings when the result differs from the clinic record.
TWO MEASUREMENTS OVER TIME
A baby can gain weight while moving to a lower percentile. The chart compares the new weight with an older age group.
For example, a girl weighing 5.8 kg at three months is near percentile 48. At four months, 6.1 kg places her near percentile 34.
She has gained 300 g, even though her percentile has fallen. Two readings alone cannot show the cause of that change.
THE REFERENCE FOR INDIA
The Indian Academy of Pediatrics recommends WHO charts for children under five. The study used to build the charts included children from India.
Breastfed and formula-fed babies can use the same WHO charts.
Tell your doctor how your baby feeds when discussing growth.
From two years, measure standing height when your child can stand. Children under five continue using the WHO growth charts.
From the fifth birthday, use an older-child growth chart. IAP charts cover Indian children aged five to eighteen years.
COMPARE YOUR RECORDS
The clinic may use a different date, chart, or measurement unit. Rounding can also change the number printed beside a growth curve.
TAKING MEASUREMENTS
Use a baby weighing scale and a length board. Ask a trained health worker to show you how to measure safely.
Place the baby scale on a firm, level surface.
Remove heavy clothing and set the empty scale to zero. Place your baby on the scale while remaining beside them. Wait until the number stops changing, then record kilograms or grams.
Use a length board, also called an infantometer, on a flat surface. It has a fixed headboard and a sliding footpiece.
Two adults help position the baby and read the length. One holds the head against the headboard, with the baby looking upward. The other gently aligns the body and positions the legs.
Avoid forcing a newborn baby to straighten their knees. Slide the footpiece against both soles, with toes pointing upward. Record the length in centimetres, including the first decimal place.
Use a standing height board and remove shoes first. Help your child stand upright, with heels against the board.
Your child should look straight ahead, with feet flat. Lower the headpiece until it touches the head through the hair. Read at eye level, recording centimetres to one decimal place.
Enter the reading as measured, along with the body position.
The calculator adjusts 0.7 cm when the position differs from the age requirement. Adding or subtracting it yourself would apply the adjustment twice.
| Age | How you measured | What the calculator changes |
|---|---|---|
| Under 2 years | Standing height | Add 0.7 cm to compare lying length |
| 2 years or older | Lying length | Subtract 0.7 cm to compare standing height |
FOLLOW THE MEASUREMENTS
Use dated measurements to see how baby growth changes over time. Bring earlier readings to appointments, even when the latest result looks expected.
Growth rate depends on weight gain and the time between readings.
Gaining 200 g over one week differs from gaining 200 g over a month. WHO has separate charts for weight gain over specific time periods.
Check the equipment, body position, units, and any copied numbers first. A change from lying length to standing height can lower the reading.
Ask for another measurement if the difference remains unexplained. Save the new reading separately, with its own date. Discuss repeated lower readings with your doctor after checking the measurements.
WHEN TO GET MEDICAL HELP
Contact a child doctor about feeding problems or unexpected growth changes.
Babies born early need growth checks agreed with their hospital team.
Birth before 37 completed weeks of pregnancy counts as premature birth. Ask the hospital team which chart and age suit your baby.
Age since birth counts the time after the actual birth date. Corrected age subtracts the weeks your baby arrived before 40 pregnancy weeks.
A baby born at 32 weeks arrived eight weeks early. Twelve weeks after birth, their corrected age is four weeks. The calculator shows age since birth, without making that correction.
A baby can have low birth weight without being born early. Low birth weight describes a birth weight below 2,500 g.
Check pregnancy weeks and birth weight separately on the birth record.
A newborn losing more than 10% of birth weight needs a medical check. The American Academy of Pediatrics recommends checking feeding and fluid intake too.
For a baby born at 3 kg, losing 300 g equals 10%. Calculate the loss against birth weight, using the same units.
Contact your doctor for poor feeding, fewer wet nappies, or worsening yellow skin. These symptoms need attention even when weight loss is below 10%. Many newborns regain birth weight within seven to fourteen days.
AAP newborn assessmentSwelling in both feet needs a prompt medical check.
Extra fluid can increase weight and hide low body weight.
Seek emergency help for severe breathing problems, fits, or failure to respond.
Emergency assessmentYOUR NEXT APPOINTMENT
Prepare the records below before your baby growth appointment.
Check measurements before your visitBring the MCP card and growth charts from earlier visits. Include any calculator PDF you want to discuss.
Pack the birth record and any hospital discharge notes.
Write down feeding difficulties, recent illness, and changes in wet nappies.
Add when each change began and questions for your doctor.
CALCULATOR QUESTIONS
Birth weight shows size at birth, even when your baby is older. Enter a recent weight and its date for a current percentile.
Enter each twin separately, using their own weight and length.
Each baby needs a separate record, even with the same birthday.
Use weight and length from the same visit for a paired result. Pairing birth length with a later weight can change the result incorrectly.
You can check either reading alone using its original measurement date.
Missing measurements or chart limits can prevent a growth comparison.
Weight alone shows weight for age; length alone shows length for age. Enter both readings to compare weight with length.
Some readings fall outside the size limits of the WHO tables. Weight-for-length covers lying lengths from 45 cm to 110 cm. Weight-for-height covers standing heights from 65 cm to 120 cm.
Early birth, uncertain pregnancy weeks, or foot swelling can also limit results.
A birth date shows age on the date you choose. The result also lists the next measurements to take.
Age alone cannot show underweight, overweight, or a growth percentile.
EVIDENCE BEHIND THE PAGE
WHO standards, Indian recommendations, and measurement instructions support the content.